Landlords often rely on the assumption that rent collection signifies adequate property management, overlooking the critical nuances that differentiate merely adequate from exceptional performance. This guide provides a framework for rigorously evaluating property managers using industry benchmarks and data-driven insights to ensure optimal return on investment (ROI) and long-term financial well-being.
1. Evolution of Property Management Measurement
Property management has evolved from informal arrangements to a data-driven science.
- Early Stages (Pre-20th Century): Informal arrangements with local caretakers, focused on rent collection and basic repairs.
- Mid-20th Century (Post-Great Depression): Financial institutions demanded a more “scientific and analytical” approach, introducing accounting-centric metrics tracked manually.
- Late 20th Century: The digital revolution brought early computer systems, task streamlining, and the emergence of Key Performance Indicators (KPIs).
- Present Era: Comprehensive, data-driven management leveraging advanced technology for holistic evaluations beyond rent collection.
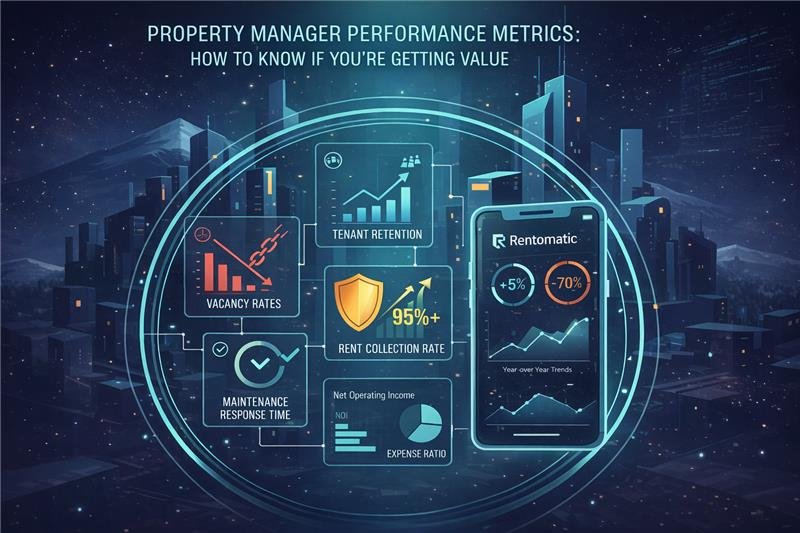
2. Key Performance Indicators (KPIs) for Property Managers
Effective property managers act as strategic partners, enhancing investment value. Landlords should monitor the following KPIs:
Vacancy Rates
Measurement: Duration (in days) a property remains vacant between tenants.
- Industry Average (Q2 2025): 7.0%.
- Healthy Range: 5-8%.
- Cost of Vacancy: $2,500/month for a $2,500 property (30 days). Allocate 5-10% of annual income.
- Rentomatic Benchmark: Aim for below 5%.
Tenant Retention
Measurement: Percentage of tenants who renew their leases.
- Current Average (Q1 2025): 55.1%.
- Good/Excellent: Above 60% is good; 70%+ is excellent.
- Importance: Reduces turnover costs ($1,000-$4,000 per unit).
Maintenance Response Time
Measurement: Days between initial request and repair completion.
- Emergency Issues: Dispatch within 2-4 hours; Completion within 3-7 days.
- Routine Issues: Response/Completion 3-7 business days (up to 30 days for non-critical).
Rent Collection Rate
Measurement: Percentage of rent collected on time.
- Target: Approaching 100%; 95%+ is acceptable.
- Importance: Crucial for stable cash flow.
Bonus Financial Metrics
- Net Operating Income (NOI): Property profitability after operating expenses.
- Expense Ratio: Total operating expenses compared to gross revenue (healthy range: 30-40%).
3. Personal Performance Dashboard
Landlords should actively track metrics:
- Request Monthly Metrics Reports: From the property manager.
- Create a Simple Spreadsheet: Track Month, Rent Collected, On-Time %, Vacancy Rate, Response Time, Tenant Retention.
- Year-over-Year Comparisons: Analyze trends for improvement or decline.
- Identify Red Flags: Spikes in vacancy, slowdowns in response times, and declines in tenant retention signal issues.
- Advanced Dashboards: Contemporary software integrates metrics like Rental Yield, Lease Renewal Rates, and Tenant Satisfaction Scores.
4. Fee Models: Percentage vs. Flat-Rate
Percentage-Based Fees
(8-12% of collected rent)
- Pros: Aligns incentives, fees adjust with income.
- Cons: Can be costly for high-income properties.
Flat-Rate Fees
($100+ per month per unit)
- Pros: Predictable costs, economical for high-income properties.
- Cons: Less incentive to maximize rent, beware of “junk fees.”
Verdict: Overall performance is more strongly correlated with a company’s commitment to results and transparency than the fee structure alone.
5. Controversies & Red Flags
Common Controversies & Ethical Dilemmas:
- Illegal Practices (discrimination, illegal evictions)
- Ethical Quandaries (conflicts of interest, lack of transparency)
- Operational Headaches (high tenant turnover, frequent late rent)
Hard Red Flags (Consider a Change):
Quantitative:
- Vacancy rates consistently >10%
- Response times >72 hours for routine maintenance
- Tenant retention rates <60%
- Late rent collection rates consistently <90%
- Difficulty obtaining performance data
- Excessive maintenance costs or suspected overcharging
- Delayed payments to owner or vendors
Qualitative:
- Poor/slow communication
- Lack of transparency
- Reactive management
- Inadequate tenant screening
- No sense of urgency
- Negative online reviews (consistently below 4 stars)
- Outdated systems and technology
Interconnected issues like slow maintenance leading to tenant dissatisfaction, increased vacancy, and reduced income highlight the importance of performance metrics.
6. Rentomatic's Performance Tracking
Rentomatic emphasizes transparency with:
- Cloud-based Real-Time Dashboards: Instant access to key metrics.
- Detailed Monthly Performance Reports: Data-driven insights.
- Technology-Driven Efficiency Metrics: Optimization across leasing and maintenance.
- Customer-Focused Accountability: Incentives aligned with landlord success.
- Open Communication: Proactive updates on performance, trends, and recommendations.
7. Future of Smart Property Management
Innovations driving greater transparency and efficiency:
- AI & Machine Learning: Predictive maintenance, intelligent pricing, automated communication.
- Internet of Things (IoT) & Smart Buildings: Real-time data for energy optimization, enhanced security.
- Advanced Data Analytics & Automation: Deeper market insights, streamlined tasks, focus on strategy.
- Blockchain Technology: Secure, immutable records for leases/transactions via “smart contracts.”
These innovations transform property management into a proactive, data-driven partnership.
Closing Thoughts
- Landlords should move beyond assumptions and objectively measure property manager performance. Metrics provide an unbiased assessment of value. Regardless of fee structure, landlords have the right to know performance details. Understanding historical context, current best practices, and emerging trends empowers landlords to demand more. Rentomatic is committed to transparent metrics, confident in delivering superior results and empowering landlords with performance data.